Skip to content
AxleGuard
Demo

Platform

Two kinds of usage. One place to explain both.

AxleGuard separates inbound integration requests from outbound provider work for routes, maps, geocoding, road snapping, elevation, weather and nearby fuel candidates. The same screen shows live call evidence, cache savings and a planning calculator per truck and per load.

Meters
2
inbound integration traffic and outbound provider work
Calculator outputs
3
monthly, per truck and per load
Call evidence
Service → cost
outcome, units, latency and list rate

In the product

The screen where this work happens.

Open AxleGuard
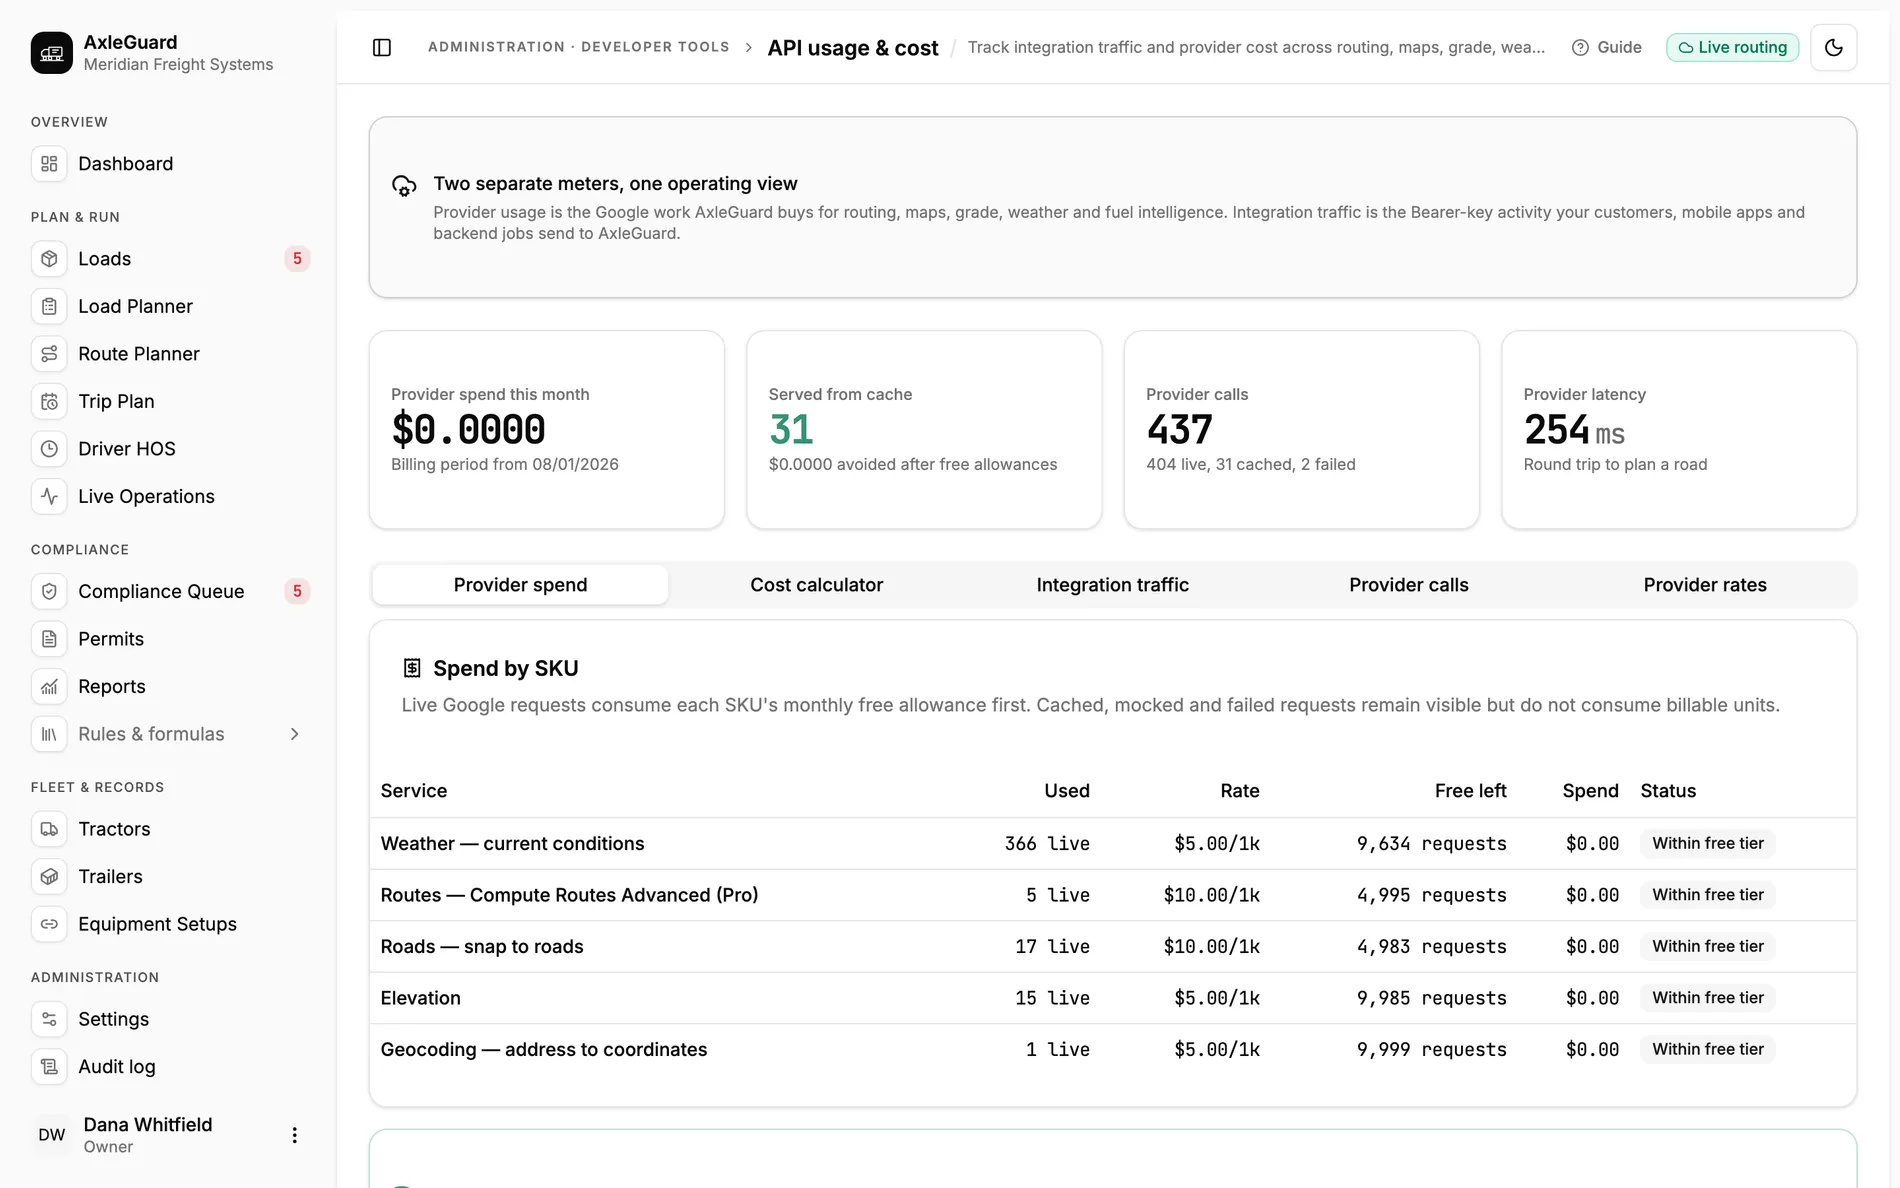
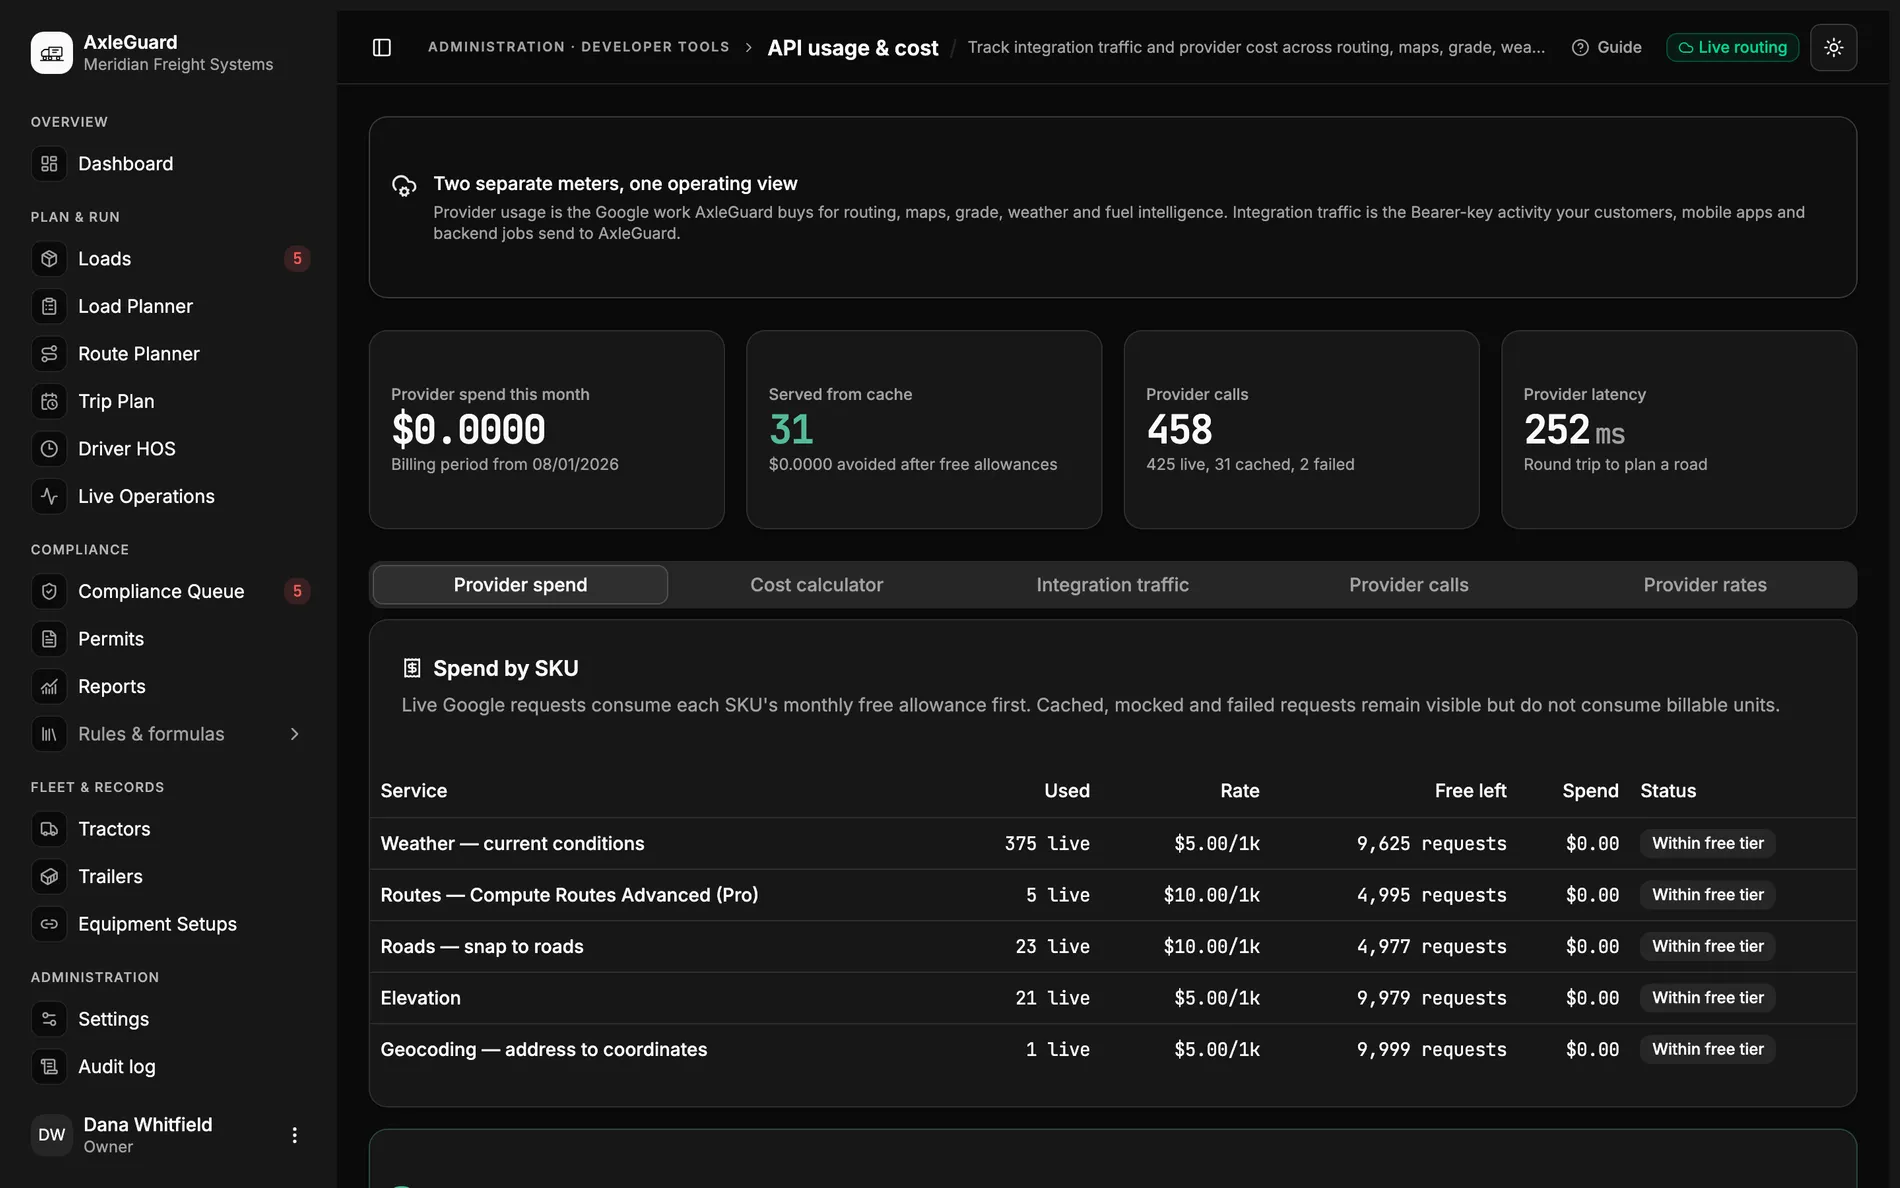
Provider spend, calls, cache use and latency beside integration traffic, rate inputs and a per-load planning calculator.

What changes

Three outcomes that matter in the operation.

Each outcome connects what the software does to the decision a planner, loader or driver can actually make.

01

Provider spend and customer traffic stay separate

Provider usage records the routing, mapping, grade, weather and fuel work AxleGuard buys. Integration traffic records Bearer-key requests sent into AxleGuard.

Why this is different

One meter cannot explain both. A customer can stay inside an API quota while the request still creates billable provider work downstream.

One API call creates more than one provider unit

A route request can trigger routing, map, grade or weather work. The inbound request log proves the customer call; the provider log explains the services and units it caused.

02

The calculator starts from the fleet’s actual planning pattern

Change trucks, loads per day, workdays, route plans, map opens, address lookups, grade profiles, weather checks, fuel searches and cache rate. Monthly, per-truck and per-load estimates update together.

Why this is different

A flat guess hides which workflow creates the bill. Activity inputs let a rollout test the lane and the behaviour that will actually be used.

Repeat lanes make cache assumptions visible

Raise the cache-hit rate and the provider estimate falls by service. The result shows the bill with caching and the larger bill the same planning pattern would create without it.

03

Every provider call can be inspected

The call log shows service, request description, outcome, billable units, latency and list-rate contribution. Cached and failed work remain distinguishable.

Why this is different

A month-to-date total without request evidence is hard to verify. The log gives engineering and finance the same trail without exposing credentials.

A weather spike appears in the provider log

The cost view shows the live weather checks, their latency and unit contribution. The calculator then shows what the same check frequency means across the fleet for a month.

How it works

From input to answer.

The logic is visible. There is no “AI decided” step between the load and the verdict.

Important boundary

The calculator uses configured rate inputs and published allowances rather than a provider invoice feed. Provider pricing changes, so current billing must be confirmed before a figure is quoted.

  1. 01

    Record the provider call

    Service, outcome, units, latency and list contribution are written when the work occurs.

  2. 02

    Apply the service allowance

    Each SKU keeps its own configured rate and monthly free allowance.

  3. 03

    Separate inbound traffic

    API-key requests keep their own quotas, success rate and latency.

  4. 04

    Model the fleet

    Activity and cache assumptions turn the rate table into per-load and monthly estimates.

Where to test it

Hard cases worth checking.

  • One inbound API request causing several provider services.
  • A route served from cache rather than billed as new work.
  • A Route Matrix request whose elements, not requests, drive units.
  • A provider rate or free allowance that changes after publication.